jueves, 30 de abril de 2020

ARE YOU AN ALLERGIC PERSON?

Hi guys!!!

How are you?? Today, I'm here to show you another idea to work statistics with your students, they'll become investigators!! 馃暤️‍♀️ Don't you think they'd love this idea?? Come on! Read this post for more information...

I don't know if you remember it, but, in the last post about statistics, I told you that we should show to our students how to classify data, the different ways to do it, the graphics we could use...

Now, I want to recommend you to introduce your students in the process of creating their own graphics with their own collection of data! So as to do it, I've thought about working with allergies. What's your opinion about it? I'm going to explain to you my idea...


3 Reasons Why Your Indoor Allergies Are Worse in the Winter (and ...

We could explain to students that, in groups of 4 people, they have to search for information about allergies in their families. How to do it? Easy! In order to develop their digital competence, first of all, they'd have to create their own google questionnaire! Some of the questions that should appear are the following ones: 

  • Are you an allergic person?
  • When did you first know that you were allergic? (If you aren't allergic put "No" and if you are put 0,1, 2, ...) 
  • How many different allergies do you have? (0,1,2, ...)
  • What are you allergic to?

Some of their relatives have to complete the questionnaire, and then, with all the data, they could create different graphics using Microsoft Excel!

For example, they could calculate the percentage of people that are allergic and compare it with the one of people who are not allergic, they could classify people depending on the moment (their age) they discovered they had an allergy... They could also classify people by the number of allergies they have... and then, they could also see which type of allergies are more common, etc. 

As you can see, they could do a really interesting project with these data. Obviously, they'd need our help during this process, but I'm sure that it'll be worth it!

What do you think about it? Let me know your opinion in the comments!

Thank you!!!!

jueves, 23 de abril de 2020

Games to learn how to count

Hi everyone!

I'm here again to share with you a really interesting video I've found about measurement. As you probably know, there are a lot of aspects related to measurement, and today, I've decided to find out about counting. Maybe you think that it's really basic, but it's necessary to work this content. 

Children, when they are small, don't know how to count, must learn the numbers and the way they increase, so, if we give class to students of 6 or 7 years old, it would be essential to ensure that they are able to count in a proper way and identify the different numbers. Due to this fact, I want to share with you the following video 


I firmly believe that all the activities proposed in this video are AMAZING! And you could use them in class, or even with your children! I'm sure they'll love the tasks, and the materials are really easy to obtain and build, so... what are you waiting for???

Come on! Let's build these materials for your students... However, I want to advise you that you can build the materials with them too! You can use the Art Education lessons so as to work on these materials, and this way, the students realize that subjects are so connected! Don't you think it would be great?

Let's go!!! See you soon!

martes, 14 de abril de 2020

Representation of data

Hi there!!

As everybody knows, we're currently living a really complicated moment in our country and other parts of the world because of the coronavirus... We usually try to get children out of these types of problems, but I think that we could use it to continue teaching them about measurement.

In this case, we could show different ways to represent the data of the infected people in Spain, such as the following examples: 

We can use a cartogram. With circles of different size, indicating on a map the number of people infected in each autonomous community  (taking as a reference the 21st May):


We can use a population pyramid so as to show the distribution of cases by sex and age in Spain:


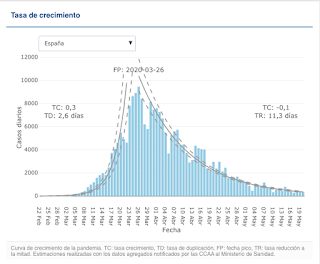
The evolution of the pandemic in Spain. I mean, its growth curve. We could show it with a bar graph:


It's evident that there are a lot of ways to represent the data, but here I've shown you several examples. If you want to work it with students, you could show them some example like these ones and then, they could create their own representations of data, following your indications. I'm sure they will enjoy it and, at the same time, they are learning about something important and contemporary. I believe that I'd use this type of activities in the 6th grade, but it's up to you!

What do you think about that??


See you in the next post! Bye bye!

mi茅rcoles, 1 de abril de 2020

I measure my school... I measure my world

Hi everyone!


Today, I'm here to show you a new challenge you can do with your students. Are you ready??

In this challenge, students would have to measure their school! I think that they would be really interested and motivated with this activity. What do you think?

First of all, we have to decide what we want that students measure, for example: the playground, a class, the hall... whatever we want to. The challenge is that students have to draw a reduction scale plan of what they have measured. So... we have to explain to them how to do it. 

Depending on the measure of the place we have selected, the scale would be different, but I recommend you to do an example with the students, like this one:

We have a class that measures 10 metres long and 4 metres wide. We want to represent it on an A4 sheet of paper, so, I need to know its measurements: 29,7 centimetres long and 21 centimetres wide. 

Now so as to have all the data in the same unit, we change the 10 metres long and 4 metres wide of the class to centimetres: 10000 cm x 400 cm. We want to draw this in the sheet of paper, but we don't have enough space to do it, so... let's do a reduction scale!

We have to think about how much we want to reduce our original space. In this case, we are going to try to divide it by 20, and our scale would be 1:20. It means that a centimetre in the scale would be 20 centimetres in the real life. If we do that, we'd have 10000:20, that would be 50 cm, and 400:20, that would be 20 cm. As you can see, this is not useful for us, because this space wouldn't fix in our sheet of paper:


We cannot draw 50x20 cm in a sheet of 29,7x21 cm

So, we have to continue trying scales so as to find one useful for drawing this classroom... we have to reduce it more, so we would try 1:30, 1:40... until we find the good one! Are you ready to put into practice this game with the students? I'm sure they'll love it... you can do it helping them, and little by little, they will be able to do it by themselves. 

But... first of all, don't you think that we should explain to the students the concept of scale? Here, we have a video in Spanish that could be really useful for teaching this concept!


I hope you'll like this post... if you have some recommendations, feel free to comment!!

Bye bye!! 馃樈